Structuring Facebook Ad Intelligence for Creative Testing and Workflow
Effective Facebook advertising requires more than raw data aggregation; it demands a structured approach to analyzing competitor creative and internal performance metrics. Developing a repeatable workflow for ad intelligence allows marketers to translate discovery and reporting insights directly into campaign optimization.

Sections
Tracking Facebook ad performance effectively requires moving beyond simply collecting key metrics like click-through rate (CTR), cost per click (CPC), and return on ad spend (ROAS). Modern marketers require organized systems that centralize data, provide clear visualizations, and deliver actionable insights for creative iteration.
What Are Structured Ad Intelligence Workflows?
Ad intelligence systems help track, organize, and understand performance across digital channels, ensuring metrics are gathered in one place for rapid use. They are designed to streamline the measurement of efficiency, track ROI, and inform strategic decisions for ongoing ad spend.
These tools generally fall into two categories: native platform offerings and specialized third-party solutions. Native options, such as Meta Ads Manager, offer direct access to campaign data but may limit customization and cross-platform visibility.
Third-party platforms layer on critical features like enhanced visuals, creative analysis capabilities, and consolidated reporting across networks. This external approach is often necessary when managing complex, high-stakes campaigns that run across Facebook, Instagram, TikTok, and other major platforms.
Categorizing Tools for Ad Intelligence Needs
The selection of ad intelligence tools depends heavily on the team structure and core objectives, whether the focus is on creative performance, agency management, or broad multi-platform visibility.
Creative Performance Analysis and Visual Feedback
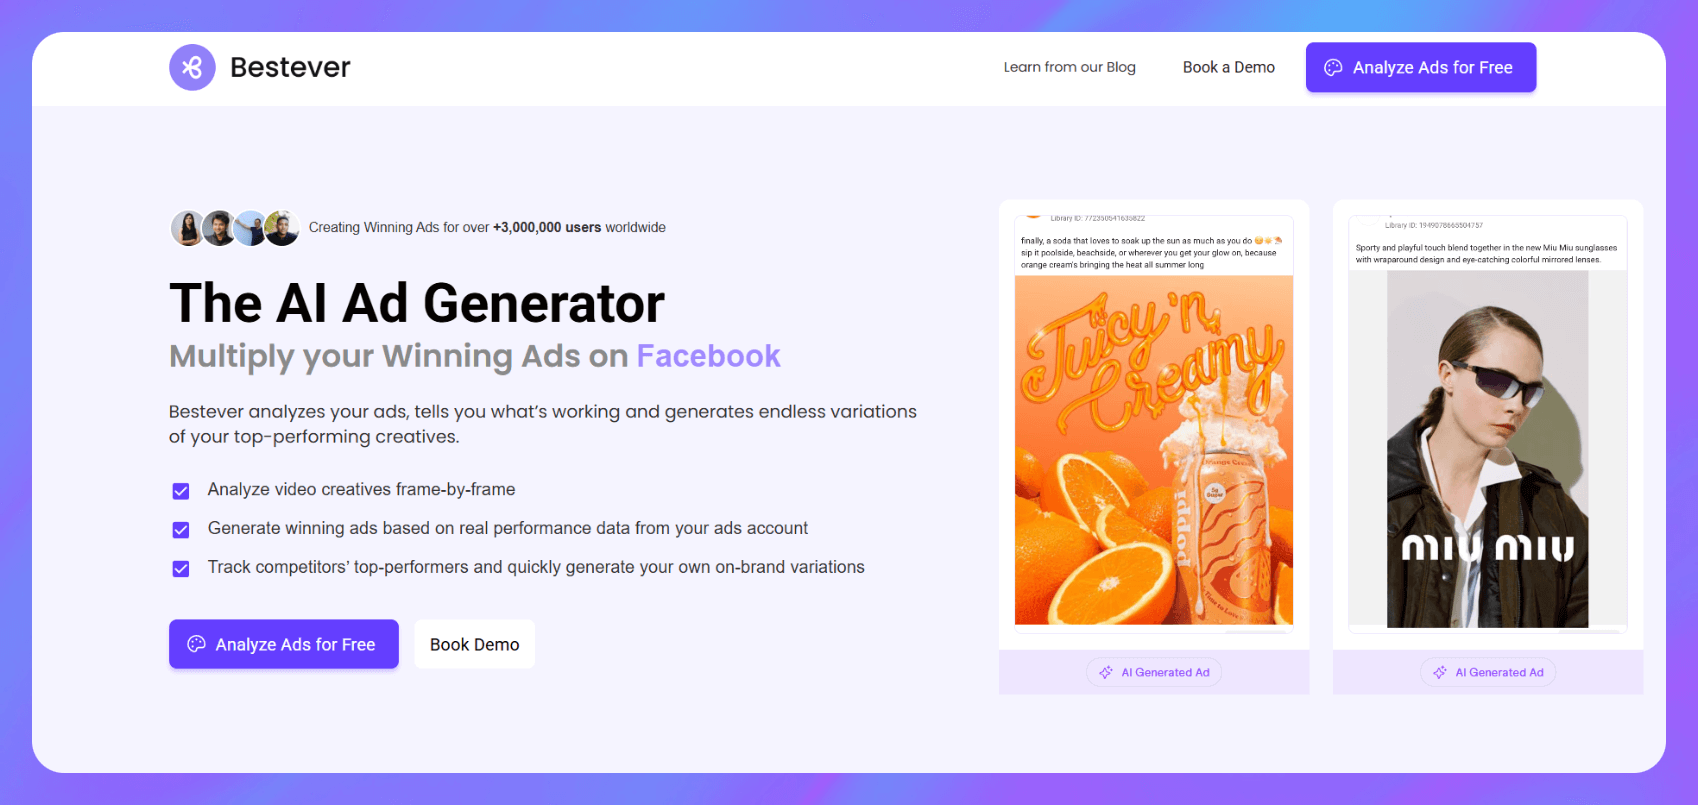
A specialized subset of tools focuses entirely on scoring creatives based on engagement metrics like hold rate and scroll-stopping power. These solutions help marketers quickly identify which visual assets are performing and why, often providing AI-backed suggestions for improving low-performing ads and tracking creative fatigue.
Multi-Platform Reporting and Dashboarding
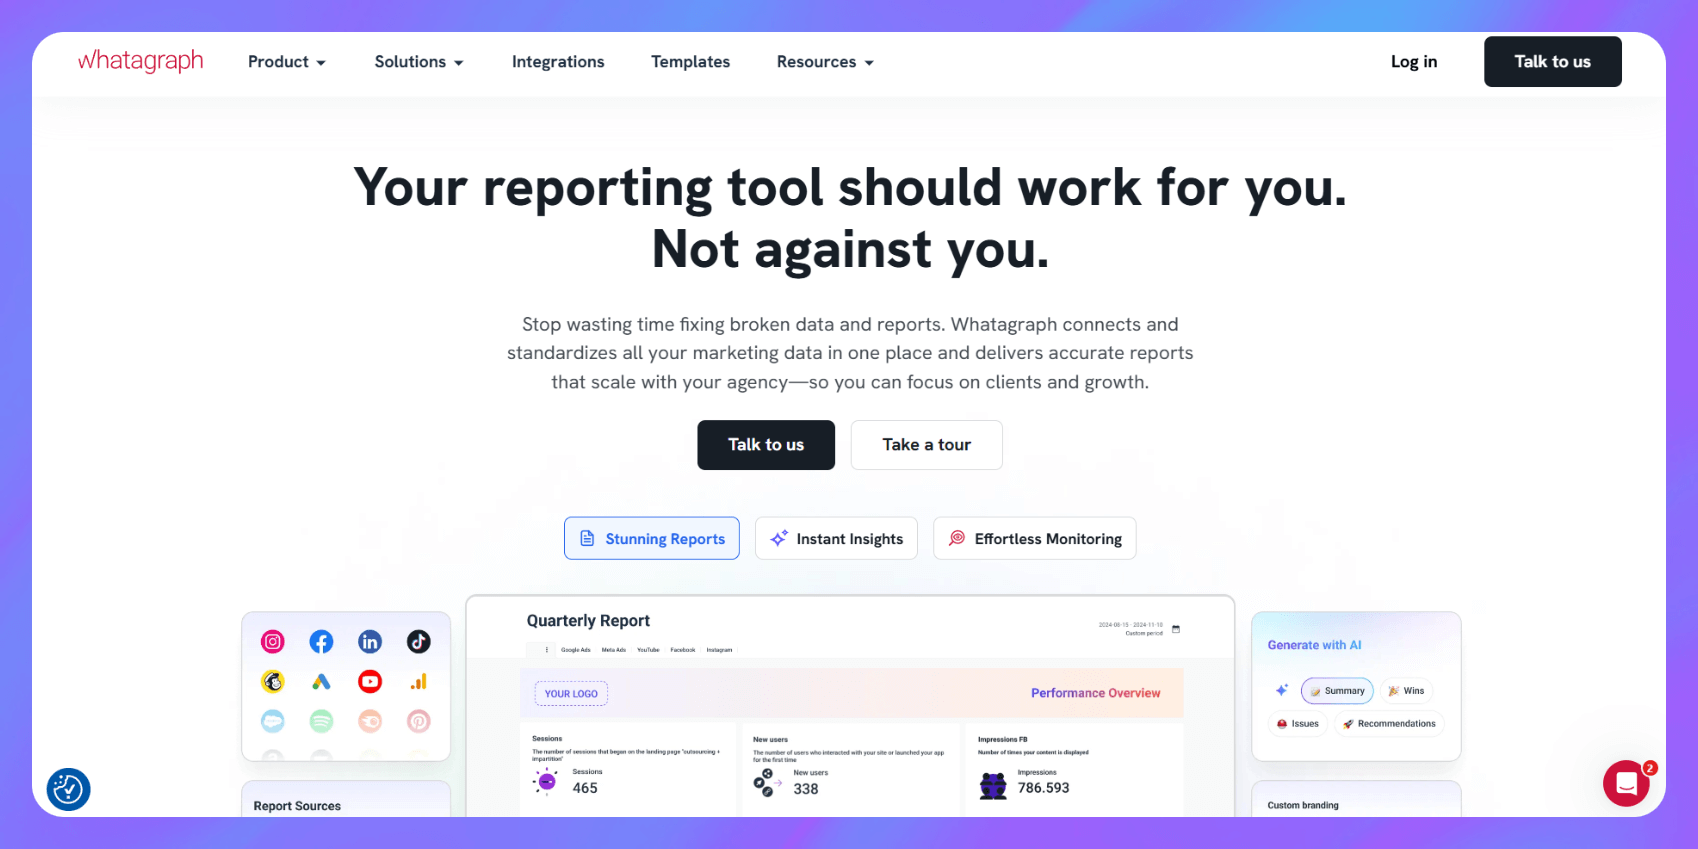
Many solutions exist to centralize data visualization across different ad ecosystems. Platforms like Whatagraph and Databox allow teams to pull performance data from Facebook alongside sources like Google Ads, LinkedIn, and Shopify, generating live, visual reports.
Agency and Client Management Solutions
Agencies managing numerous client accounts prioritize tools built for multi-client support, automated scheduling, and white-labeled delivery. AgencyAnalytics and ReportGarden help centralize data for customized, branded reports that simplify client communication across various channels including PPC, social, and SEO.
The Role of Data Connectors and Custom BI
Some data-savvy teams or analysts require maximum flexibility, preferring to work within their own custom reporting environment. For these users, the primary need is robust data connectivity and automation.
Data automation tools like Supermetrics pull Facebook Ads data directly into external platforms suchably as Google Sheets, Excel, or Looker Studio, allowing full control over queries and visualization.
Conversely, for teams that require consistent, non-interactive client updates delivered via email, solutions like Swydo specialize in scheduling customizable PDF reports complete with space for goals and executive summaries.
Creative Analysis: Comparing Angles, Hooks, and Formats
True creative analysis moves past high-level metrics to isolate the effectiveness of specific ad components. This involves developing a taxonomy for tagging creative types, such as defining different video hooks or product demonstration formats.
By scoring assets based on visual impact and engagement metrics, marketers can understand performance drivers at a granular level.
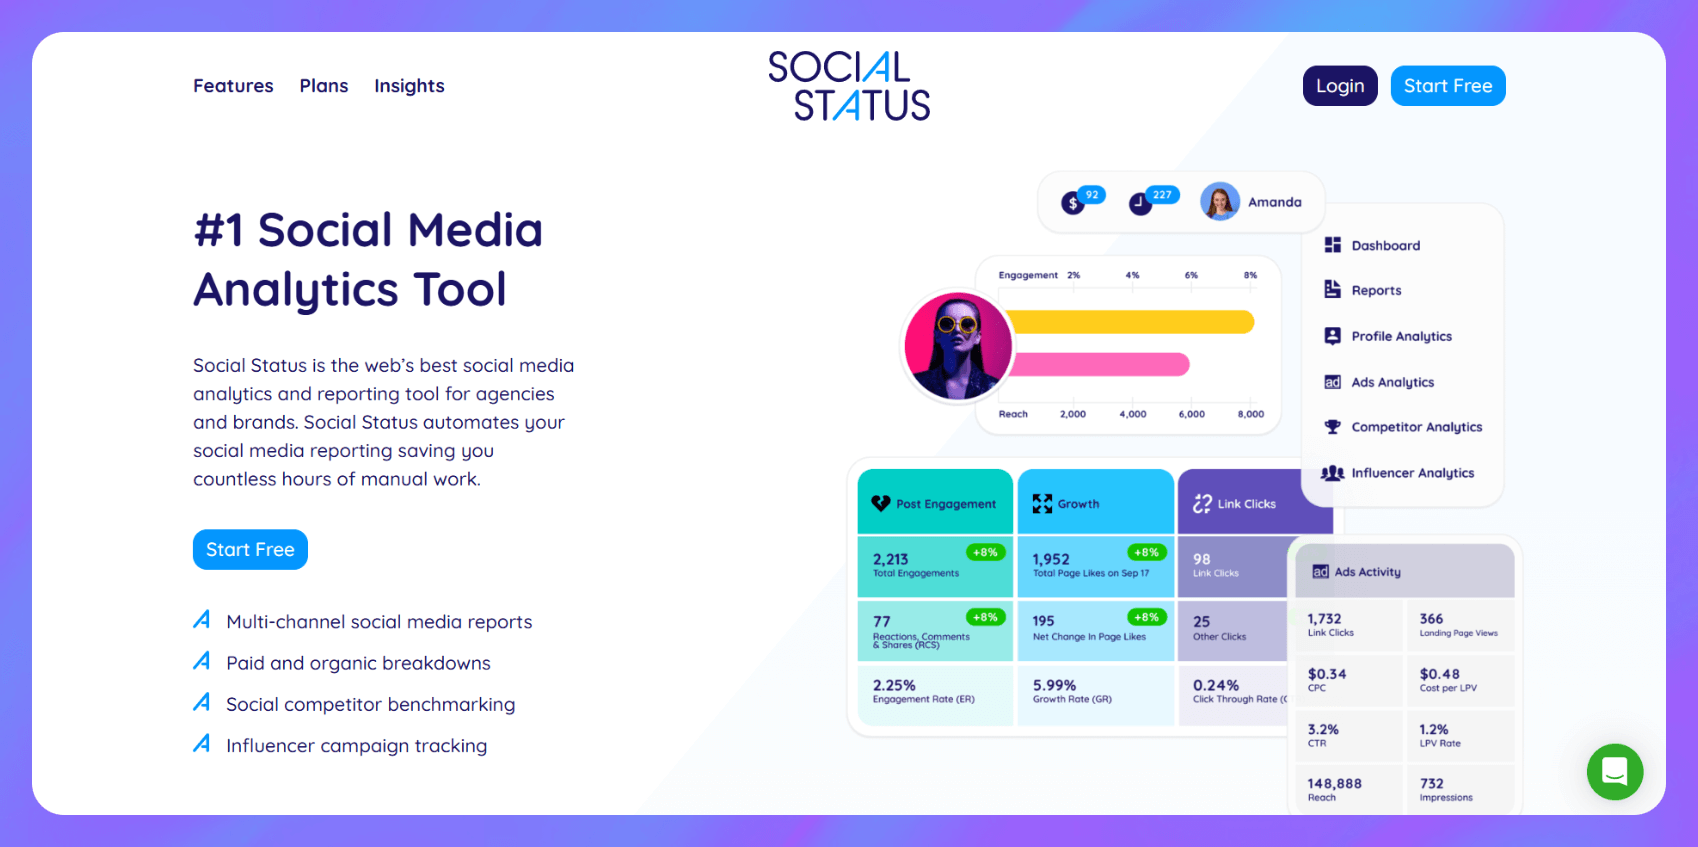
Interactive dashboards (Databox) help teams track KPIs across platforms in real time, while competitive benchmarking tools (Social Status) provide context by comparing internal performance against industry standards or key competitors.
 KPI tracking and alert dashboard display."
data-placeholder="interactive-kpi-dashboard.webp"
loading="lazy"
/>
KPI tracking and alert dashboard display."
data-placeholder="interactive-kpi-dashboard.webp"
loading="lazy"
/>
Turning Insights into Testable Campaign Hypotheses
Ad intelligence should directly translate into new testing opportunities. When reviewing campaign data, marketers should focus on identifying variations that significantly outperform or underperform expectations.
This requires reporting tools that allow for deep filtering and segmentation, helping refine both targeting and messaging angles.
Tools that integrate paid and organic data, such as Sprout Social, enable teams to identify high-engagement organic content that can be leveraged effectively in paid media.
 PPC channels."
data-placeholder="cross-ppc-report.webp"
loading="lazy"
/>
PPC channels."
data-placeholder="cross-ppc-report.webp"
loading="lazy"
/>
Structured Approach to Tool Selection
Choosing the appropriate tool depends on several factors: the team structure, preferred reporting style, budget constraints, and the primary campaign goal. Agencies often prioritize multi-account access and white-label features, while in-house teams may focus on real-time dashboards for rapid optimization.
If the team uses custom attribution models, selecting a tool that flexibly supports these models is crucial for aligning reported metrics with strategic business outcomes.
Practical Workflow for Optimizing Facebook Campaigns
Implementing a repeatable workflow ensures that ad intelligence findings are consistently applied to future campaigns, maximizing budget efficiency and creative lifespan.
- Step 1: Discovery and Research: Utilize ad intelligence platforms to actively research successful ad creative, messaging angles, and formats currently running across networks like Facebook, Instagram, and Twitter/X.
- Step 2: Metric Centralization: Integrate data from the Meta Ads Manager into a centralized reporting platform (e.g., Databox, Whatagraph) to consolidate core metrics (CTR, ROAS) into a single view.
- Step 3: Creative Tagging and Scoring: Implement a system for tagging internal creative assets by hook type or format; use specialized analysis tools to score these creatives based on measured engagement.
- Step 4: Performance Isolation: Use flexible filters and breakdowns within the reporting suite to isolate performance changes linked to specific creative tags or audience segments.
- Step 5: Hypothesis Generation: Based on the data, formulate a concise, testable hypothesis about how adjusting a specific creative element (e.g., visual style or CTA placement) will improve a defined KPI.
- Step 6: Automated Reporting Delivery: Schedule automated, customized reports (e.g., Swydo, AgencyAnalytics) to deliver periodic performance summaries to stakeholders without manual data collection.
Common Pitfalls in Ad Intelligence and Reporting
Avoiding standard errors in data gathering and interpretation is essential for maintaining campaign accuracy and maximizing optimization speed.
- Relying solely on aggregate metrics: Campaign-level ROAS can mask poor performance in specific ad sets or individual creatives. Corrective Principle: Always break down metrics to the lowest ad or creative tag level for granular inspection.
- Neglecting creative performance scoring: Focusing only on financial metrics (spend, CPA) misses the critical factor of visual effectiveness and audience drop-off. Corrective Principle: Integrate specialized tools that quantify creative impact early in the diagnostic workflow.
- Using generic reports without context: Raw data dumps or templated dashboards confuse executive teams and non-media buyers. Corrective Principle: Utilize white-labeled templates and add written executive summaries, goals, and actionable insights.
- Failing to track cross-platform influence: Isolating Facebook performance ignores its interaction within a multi-touch customer journey. Corrective Principle: Implement cross-channel reporting solutions to assess Facebook’s contribution alongside platforms like Google or TikTok.
- Manual data manipulation: Relying on spreadsheets and manual data refreshing introduces delays, errors, and wastes time. Corrective Principle: Automate data transfer using stable connectors (e.g., Supermetrics) to ensure real-time accuracy in BI tools.
- Ignoring paid and organic synergy: Failing to leverage successful organic content insights in paid messaging strategies. Corrective Principle: Use integrated social management platforms to compare content engagement across both paid and owned channels.
- Lack of competitive context: Tracking internal metrics without understanding industry baselines limits ambition and optimization ceilings. Corrective Principle: Incorporate competitive benchmarking data (Social Status) to set realistic, market-informed performance targets.